1. The Seestar S50 as a Practical Data Source
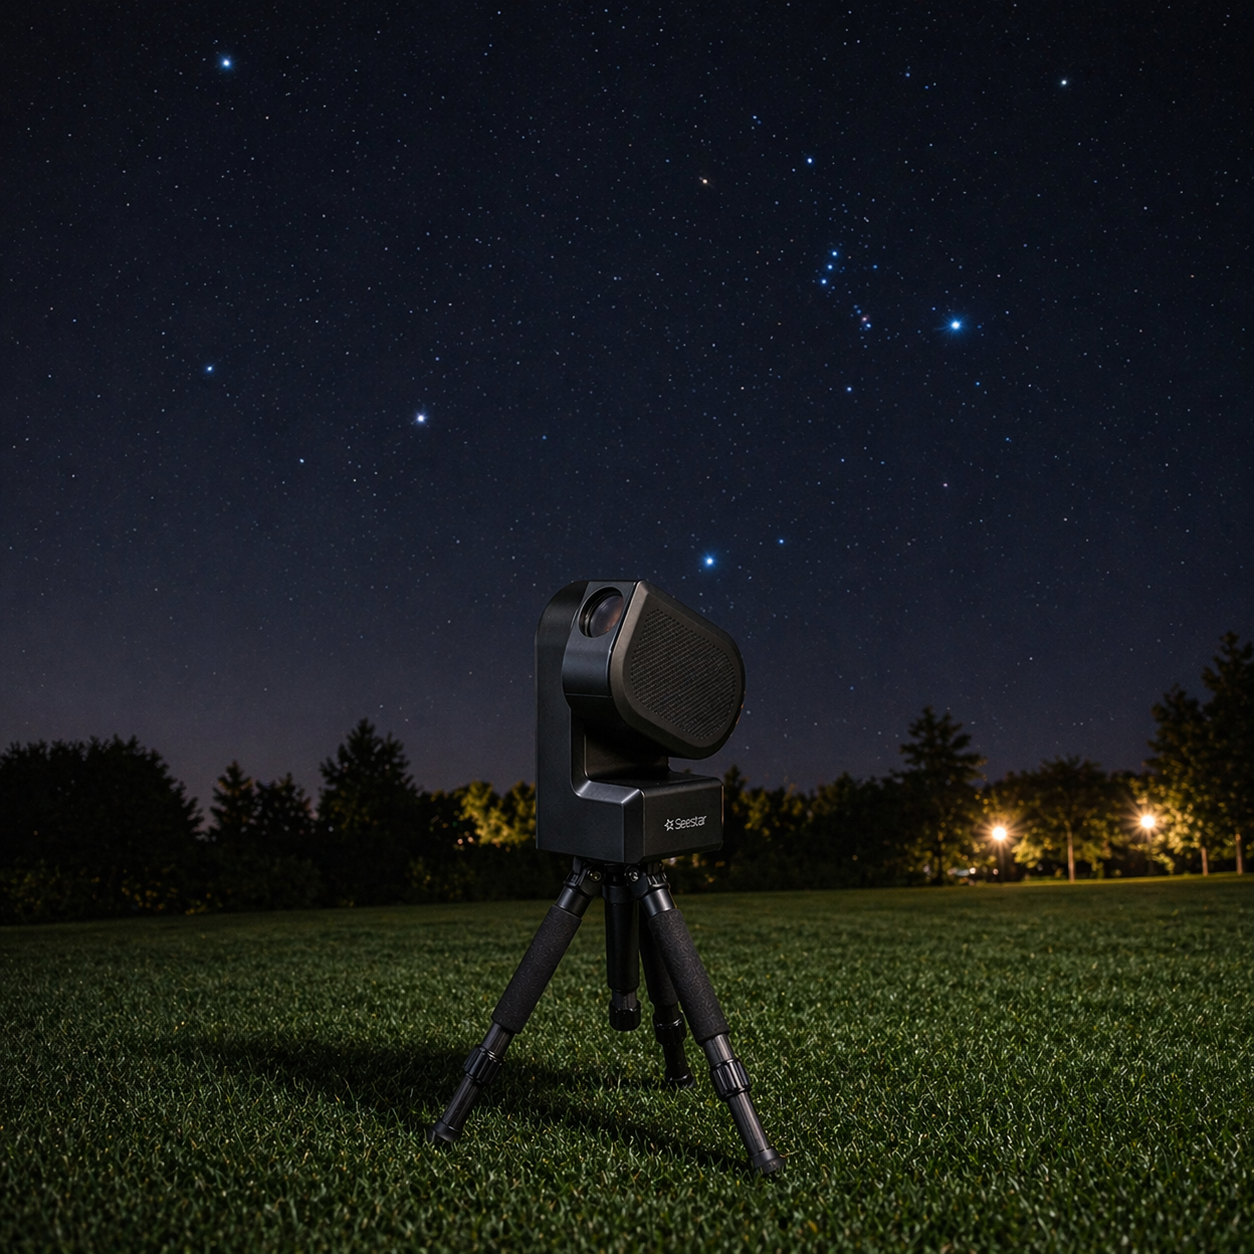
The Seestar S50 is mainly known as a compact smart telescope for assisted astrophotography. Its automation makes it accessible to many observers, but the presence of FITS output also opens the door to a more quantitative use of the instrument.
When raw FITS matrices are available, the Seestar can be used for exploratory photometry on relatively bright transients. In this context, the goal is not to claim professional-grade calibrated photometry from a consumer device, but to extract measurements that are internally consistent enough to build preliminary light curves, compare them with external databases, and test reduction strategies on real data.
This project should therefore be understood as a practical reduction workflow for citizen-science style observations, not as a claim of equivalence with dedicated scientific instrumentation.
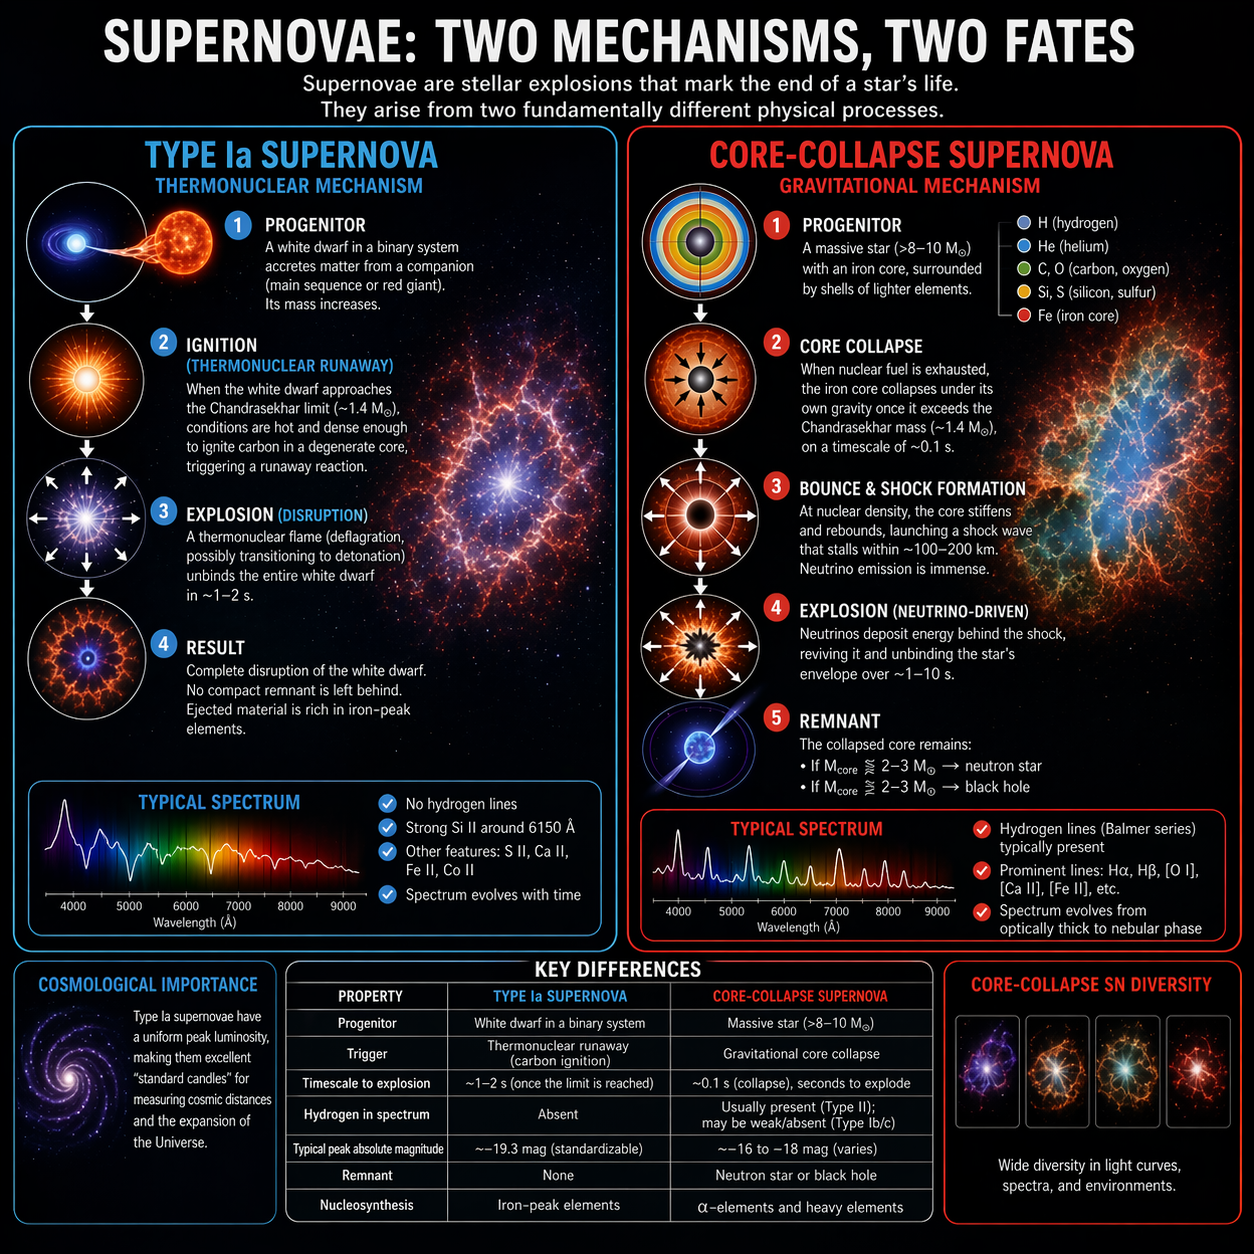
2. What is a Supernova?
A supernova is the violent explosion of a star at the end of a specific evolutionary path. For a limited time, the event can become bright enough to rival or exceed the integrated light of its host galaxy.
Main Classifications
- Type Ia (thermonuclear): an exploding white dwarf in a binary system. These events are especially important because their light curves and spectra make them useful as distance indicators in cosmology.
- Type II (core-collapse): the collapse and explosion of a massive star after it exhausts nuclear fuel in its core.
From the point of view of an observer, one of the most useful products is the light curve: the brightness of the transient measured over time. Even modest telescopes can contribute useful monitoring data when the target is bright enough and the reduction is performed carefully.
3. Why Photometry Matters
Astronomical photometry is the measurement of the brightness of celestial sources. For supernovae and other transients, repeated photometry allows the observer to reconstruct how the source evolves over days or weeks.
In practice, brightness is not measured in isolation. Atmospheric transparency, local sky background, detector response, sampling, and tracking imperfections all affect the measurement. For this reason, a common approach is differential photometry: the target is compared with a local ensemble of reference stars in the same field, whose catalog magnitudes are known.
The purpose of this software is to automate part of that workflow while keeping the user in control of the final target selection and of the interpretation of the results.
The Seestar Autopilot Pipeline (v5.18-beta)
This Python pipeline implements a reproducible differential photometry workflow on Seestar S50 FITS data. It provides WCS-based tracking, Gaia DR3 calibration, adaptive aperture photometry, valid-footprint masking for derotated or mosaicked frames, batch processing, CSV export, PDF reporting, and GIF-based visual QA.
Download Autopilot SoftwareThe Sony IMX462 Sensor and Matrix Handling
The Seestar S50 uses a Sony IMX462 CMOS color sensor. The software operates on 2D linear matrices extracted from FITS files. If a FITS file contains a 3D array, the current implementation collapses it into a 2D matrix by summing the planes before source detection and photometric extraction.
This is a practical reduction choice intended to increase usable signal for centroiding and aperture photometry. It is not presented as a physically complete treatment of the sensor response; rather, it is an operational compromise adopted for this workflow. The internal noise model attempts to account for the corresponding read-noise scaling when summed planes are used.
Sampling Analysis (Pixel Scale)
Assuming a focal length \( f = 250 \,\mathrm{mm} \) and a pixel pitch \( p = 2.9 \,\mu\mathrm{m} \), the angular sampling is:
This is in a regime where slight undersampling can occur under typical amateur seeing conditions. For that reason, the software uses sub-pixel centroiding and estimates a representative field FWHM from multiple stars. The photometric aperture is then set from that FWHM through a user-configurable multiplier, rather than from a fixed physical radius.
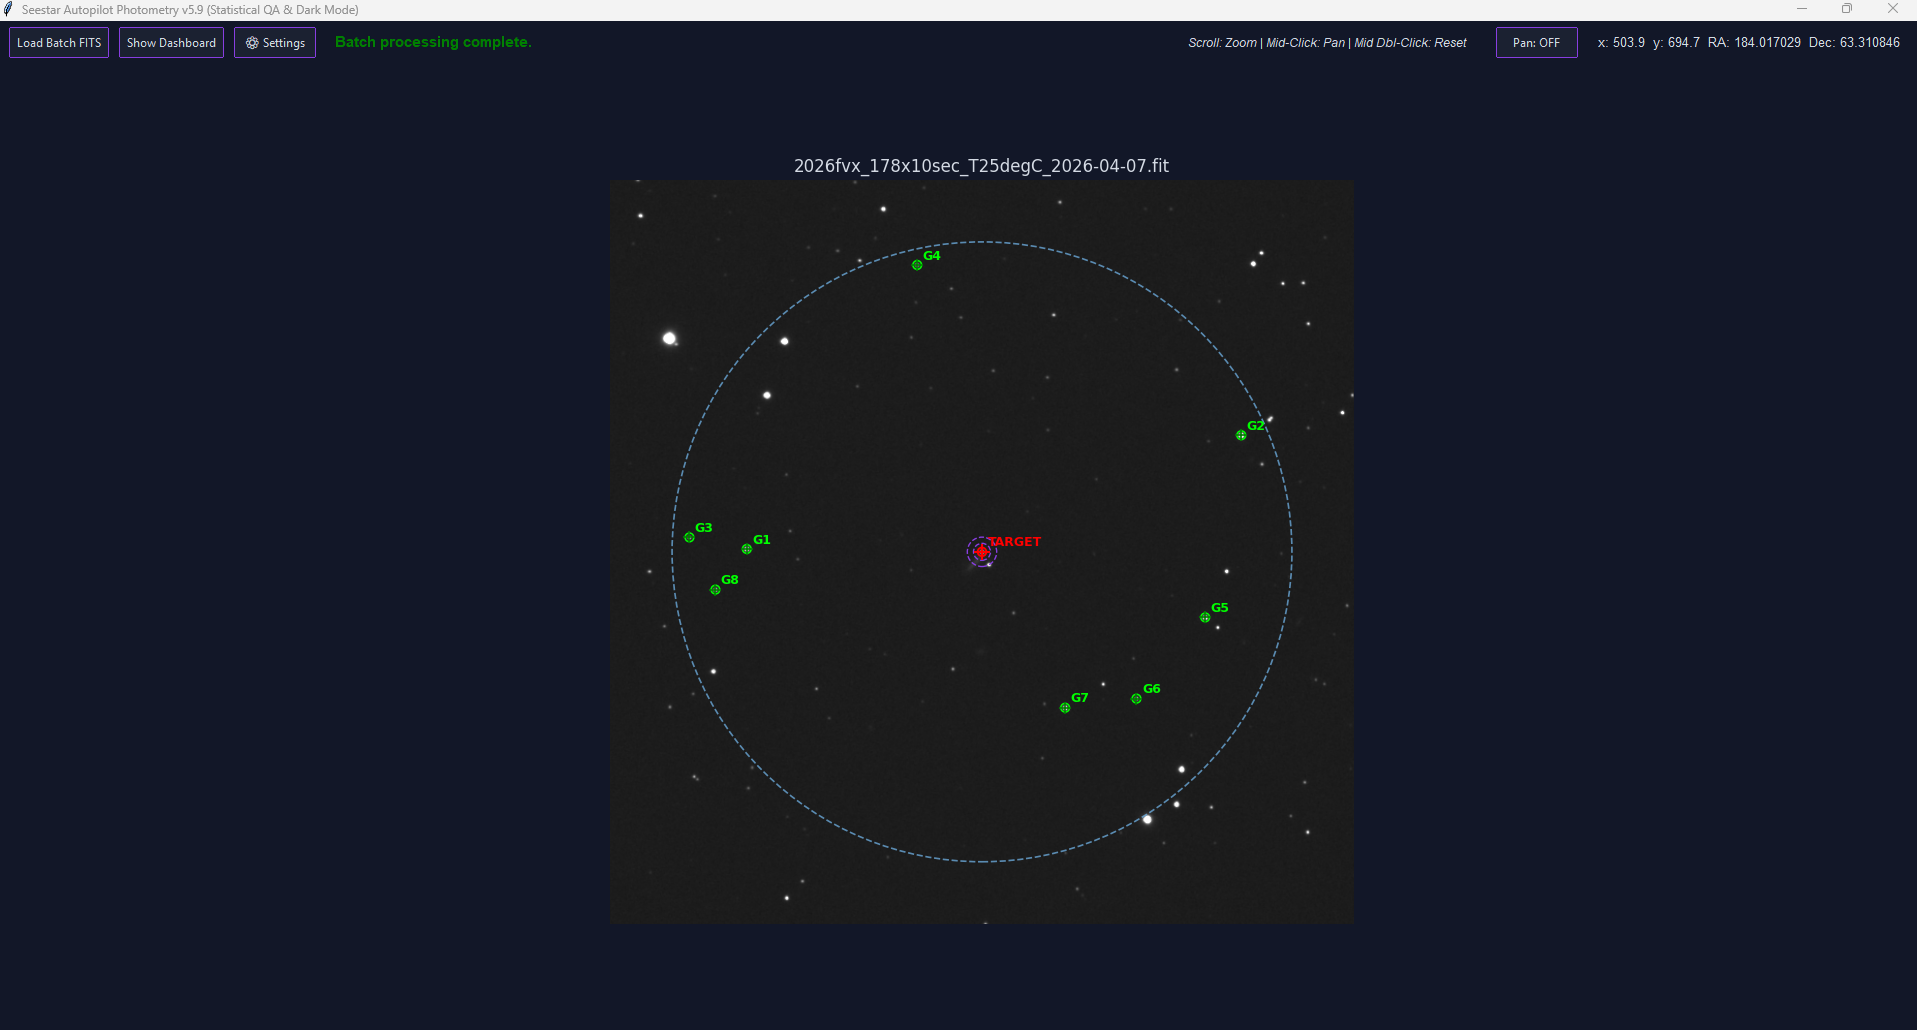
Gaia DR3 Integration and Candidate Suggestion
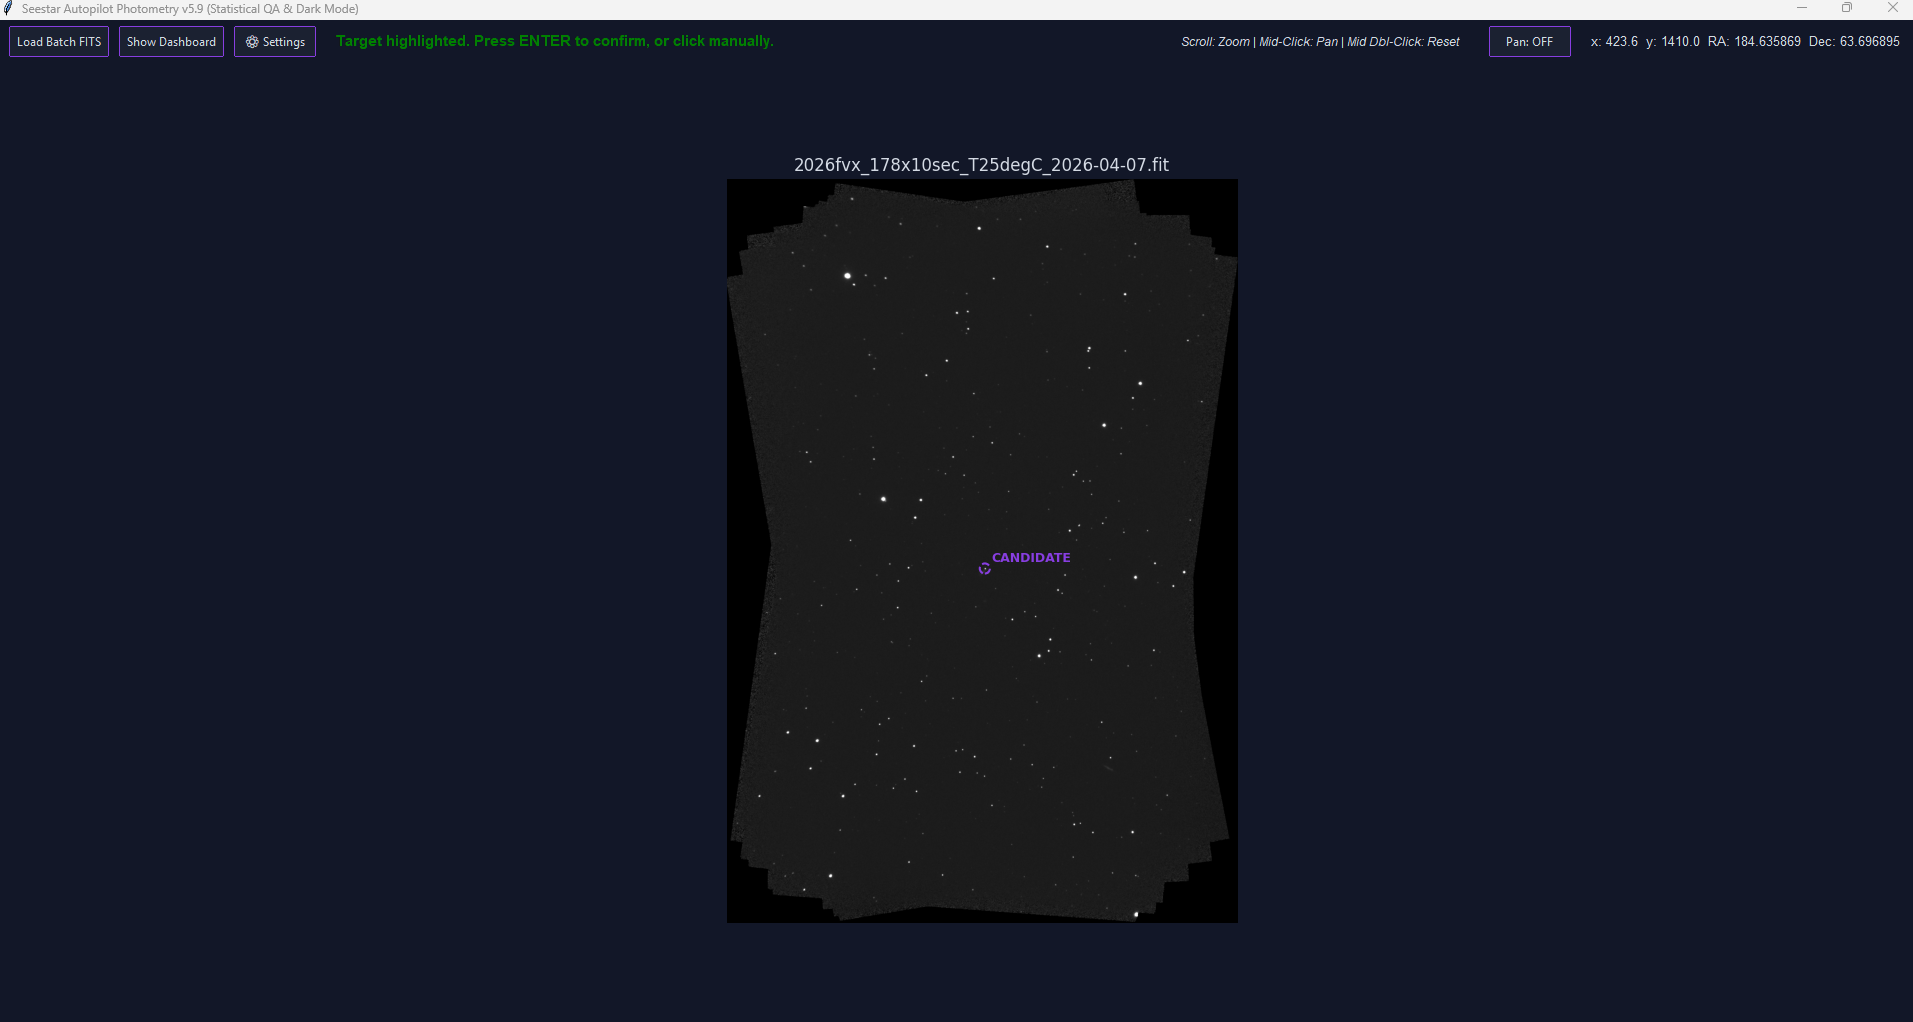
Target suggestion is based on astrometric cross-matching. The software reads the celestial WCS from the FITS header, computes a search region compatible with the image footprint, and queries Gaia DR3 through VizieR.
Detected sources from the image are matched against the local Gaia catalog. Sources that appear in the image but do not receive a plausible Gaia match within the configured tolerance are treated as unmatched candidates. The candidate closest to the optical center is highlighted as a convenience, but the final decision is always left to the user.
Fallback Query Strategy
To reduce the impact of temporary catalog-node failures or slow responses, the pipeline uses a simple fallback strategy. A primary VizieR node is queried first; if that attempt fails or times out, the request is retried against an alternative mirror.
This is a practical reliability feature. It improves robustness against transient network issues, but it should not be interpreted as a guarantee of uninterrupted service.
Aperture Photometry and Local Ensemble Calibration
The pipeline uses photutils to perform aperture photometry on the selected transient and on a local ensemble of reference stars matched against Gaia DR3.
1. Local Sky Background and Invalid-Region Masking
For each source, the flux is measured inside a circular aperture. The local sky background is estimated from a surrounding annulus and sigma-clipped to reduce contamination from nearby stars, outlying pixels, and small defects.
Version 5.18-beta extends this approach with a more robust valid-footprint masking system for black or near-zero invalid regions that can appear near the borders of derotated or mosaicked images produced by external stacking software such as Siril. These areas can otherwise bias background estimation, source detection thresholds, SNR calculation, and reference-star selection.
In addition to excluding invalid pixels from global statistics, the current implementation also checks the valid-pixel coverage of the photometric aperture and of the sky annulus. Measurements can be rejected when too much of the aperture or annulus overlaps invalid image regions. This is intended to prevent apparently good measurements from being accepted when the source is too close to a derotation border or an incomplete mosaic footprint.
The same masking logic is also used to make source detection more stable: invalid regions are not allowed to drive the background statistics or generate false detections near the black frame edges.
where \( \bar{S}_{\mathrm{sky}} \) is the clipped local sky level and \( n_{ap} \) is the aperture area in pixels.
2. Adaptive Aperture Radius
In the current version, the photometric radius is not fixed. The software estimates a representative field FWHM from a subset of bright, non-saturated stars with acceptable shape, and then sets the aperture radius as:
where \( k_{\mathrm{FWHM}} \) is a configurable parameter. This dynamic scaling improves signal-to-noise ratio under varying seeing and sky-background conditions. The approach is implemented as a practical empirical prescription for Seestar data and should not be interpreted as a universally optimal aperture rule.
3. Shape Filtering for FWHM Estimation
The field FWHM is estimated from a subset of bright stars after rejecting sources that are too elongated. A simple ellipticity filter is used to reduce the influence of tracking errors, blends, or obviously non-stellar profiles. A sigma-clipped median is then used to derive the representative FWHM of the field.
4. Formal Noise Model and SNR
The formal signal-to-noise ratio is computed from a CCD-style noise model that includes source Poisson noise, sky noise in the aperture, uncertainty in the sky estimate, and read noise:
where \(F_e\) is the net source signal in electrons. When summed image planes are used, the code applies an internal read-noise scaling intended to better reflect the effective noise budget of that choice.
Additional safeguards include a minimum target SNR threshold, rejection of frames with too few valid reference stars, local sky-noise checks, aperture/annulus valid-coverage checks, a lower bound based on reference-star photometric noise, and a Student-t style correction for small reference-star samples.
5. Reference-Star Selection
Reference stars are selected within an expanding radius around the target. The pipeline excludes stars too close to the transient, too close to the image borders, or likely saturated. Preference is given to stars with flux comparable to the target, in order to limit some detector- and dynamic-range-related effects. In v5.18-beta, a larger candidate pool is evaluated before the final reference ensemble is selected, improving the probability of retaining a stable set of references across derotated or partially masked frames.
6. Local Zero Point and Optional Color Dependence
For each matched Gaia reference star, an instrumental zero point is computed as:
The ensemble is cleaned through robust raw zero-point filtering. This design choice was retained because residual-based clipping after a color fit proved too fragile for the small reference ensembles typical of Seestar S50 fields.
When enough reference stars have valid Gaia \(BP-RP\) colors, the software also fits a first-order color dependence of the local zero point. In the current v5.18-beta release, the color fit is deliberately conservative and requires a sufficient number of valid color references; otherwise the pipeline falls back to a mean zero point without a color term:
The minimum number of valid color references required for this fit is currently set to 6. This avoids applying a color correction when the reference ensemble is too small to constrain the slope reliably.
The target magnitude is then estimated as:
Here the target color is not measured directly by the pipeline. A configurable assumed color and an associated uncertainty are used as empirical priors. This correction is meant as a pragmatic attempt to reduce part of the mismatch between the instrumental response and the Gaia \(G\) passband. It is not a full passband transformation and should be interpreted with caution.
7. Error Propagation for the Color Fit
When the color-term fit is available, the zero-point uncertainty is not estimated by simple averaging alone. The code uses the covariance matrix returned by the linear regression and propagates both the fitted parameters and the assumed target-color uncertainty:
This provides a more explicit estimate of the calibration uncertainty introduced by the local color fit and by the fact that the transient color is assumed rather than measured directly.
Interactive Workflow, Reprocessing, Blink Viewer, and Formal Precision
The workflow remains intentionally interactive. The software can suggest a transient candidate, but the user confirms the target manually. Once the target is accepted, the same sky position is propagated across the loaded batch and processed frame by frame.
The current version includes a settings panel for key empirical parameters such as assumed target color, color uncertainty, FWHM multiplier, ellipticity threshold, and minimum accepted SNR. These settings are stored locally and can trigger a full batch recalculation when the user asks to apply them to the existing dataset.
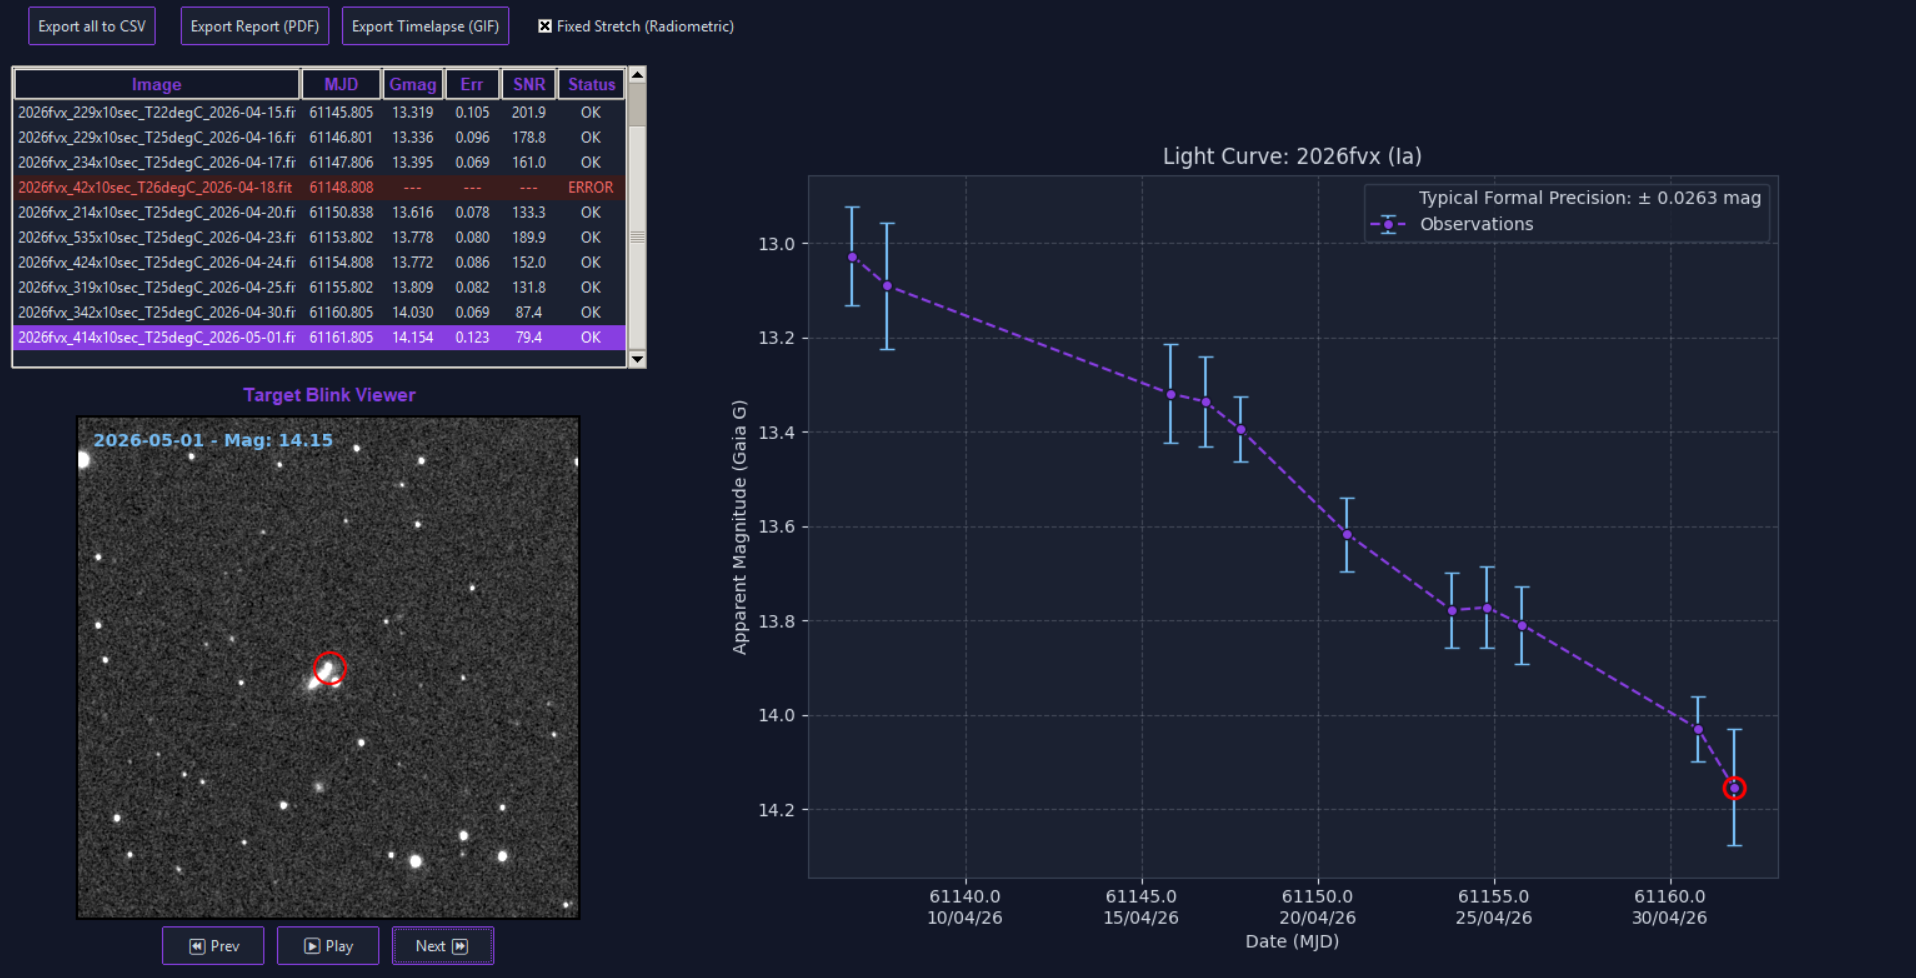
Interactive QA: Brushing and Linking
The dashboard includes real-time synchronization between the measurement table, the light-curve plot, and the Target Blink Viewer. As the player iterates through frames, or when a row is selected, a marker highlights the corresponding data point on the plot.
This allows direct visual correlation between image conditions, tracking quality, artifacts, and photometric measurements.
Fixed Stretch vs Dynamic Stretch
The Target Blink Viewer and exported GIF can use either a fixed radiometric stretch or a per-frame dynamic stretch.
- Fixed Stretch: contrast limits are derived from a reference frame and applied consistently across the sequence, while the background level is allowed to float. This gives a more stable visual representation of relative brightness changes.
- Dynamic Stretch: each frame is independently stretched. This is useful for quality control because it enhances noise, gradients, and artifacts, but it does not preserve visual consistency of brightness between frames.
Formal Precision of the Observing Run
For the accepted observations in a batch, the software reports a formal aggregate precision using inverse-variance weighting:
This is useful as an internal summary of the formal error budget of the accepted measurements. It should not be confused with the physical scatter of the light curve, since a transient is intrinsically variable. Systematic effects can still dominate even when the formal weighted precision appears small.
The pipeline exports a CSV file with per-frame measurements, a PDF summary report, and an optional timelapse GIF for visual documentation.
What Changed in v5.18-beta
Version 5.18-beta mainly focuses on robustness with real-world Seestar datasets, especially frames that have been derotated, aligned, or mosaicked before photometric extraction.
- Valid-footprint masking: black or near-zero invalid borders from derotation and mosaics are excluded from statistics and photometry.
- Aperture and annulus coverage checks: measurements can be rejected when the source aperture or sky annulus overlaps too much with invalid image regions.
- More stable source detection: invalid pixels are prevented from biasing the background statistics used by the detection stage.
- Improved reference-star robustness: a larger candidate pool is evaluated before selecting the final reference ensemble.
- More conservative color-term usage: the color fit is applied only when enough Gaia BP-RP reference stars are available; otherwise the pipeline falls back to a mean zero point.
- Local sky-noise QA: additional checks help reject measurements affected by abnormal local background conditions.
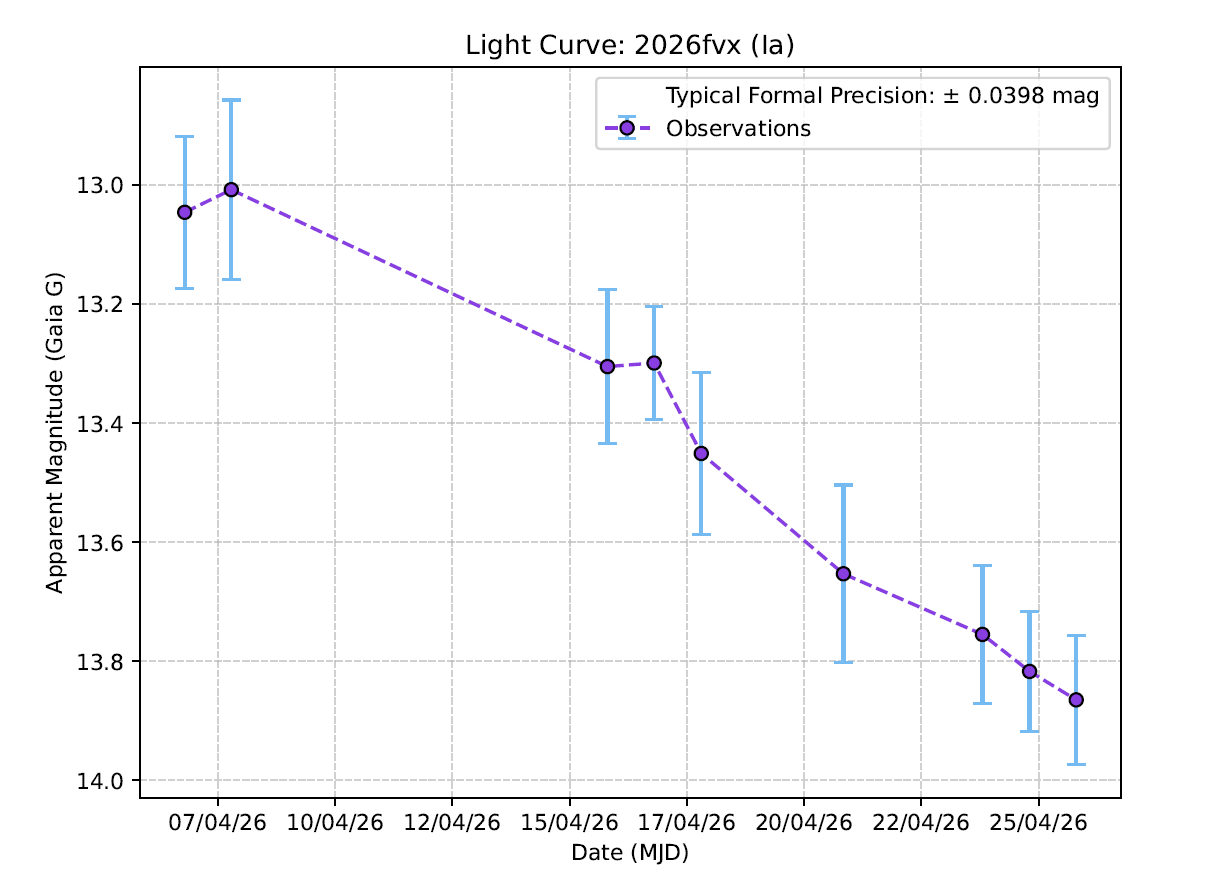
Preliminary Validation: SN 2026fvx
A preliminary consistency check has been performed using SN 2026fvx. The light curve obtained with the v5.18-beta pipeline was compared with independent RAPAS measurements using the available A/G comparison column as the closest external proxy for a Gaia-like response.
This result is statistically consistent with the estimated uncertainties and does not show an obvious systematic deviation in this limited comparison.
However, this should be treated only as an initial consistency check. The dataset is small, only one object has been tested so far, and no full transformation to a standard photometric system has been performed. A more robust validation requires additional targets, longer time baselines, and independent comparisons with other datasets.
1. Howell, S. B. (1989). Two-dimensional aperture photometry - Signal-to-noise ratio of point-source observations and optimal data-extraction techniques. Publications of the Astronomical Society of the Pacific, 101, 616-622.
2. Bevington, P. R., & Robinson, D. K. (2003). Data Reduction and Error Analysis for the Physical Sciences. McGraw-Hill.
3. Sony Semiconductor Solutions Corporation. IMX462LQR-C Diagonal 6.46 mm (Type 1/2.8) CMOS Solid-state Image Sensor Datasheet.
4. Gaia Collaboration et al. (2022). The Gaia Data Release 3. Astronomy & Astrophysics.
The implementation described above is empirical and software-specific. Some calibration choices were tuned on real datasets obtained with the Seestar S50 and should be regarded as practical working assumptions rather than universally validated reductions. The SN 2026fvx comparison is encouraging, but it is not yet a complete validation of the pipeline.